Getting Started with Gantt Charts
Getting Started with Gantt Charts
Gantt charts are one of the most powerful tools for project planning and visualization. Whether you're managing a small team project or a complex multi-phase initiative, understanding how to create and use Gantt charts effectively can transform your planning process.
What is a Gantt Chart?
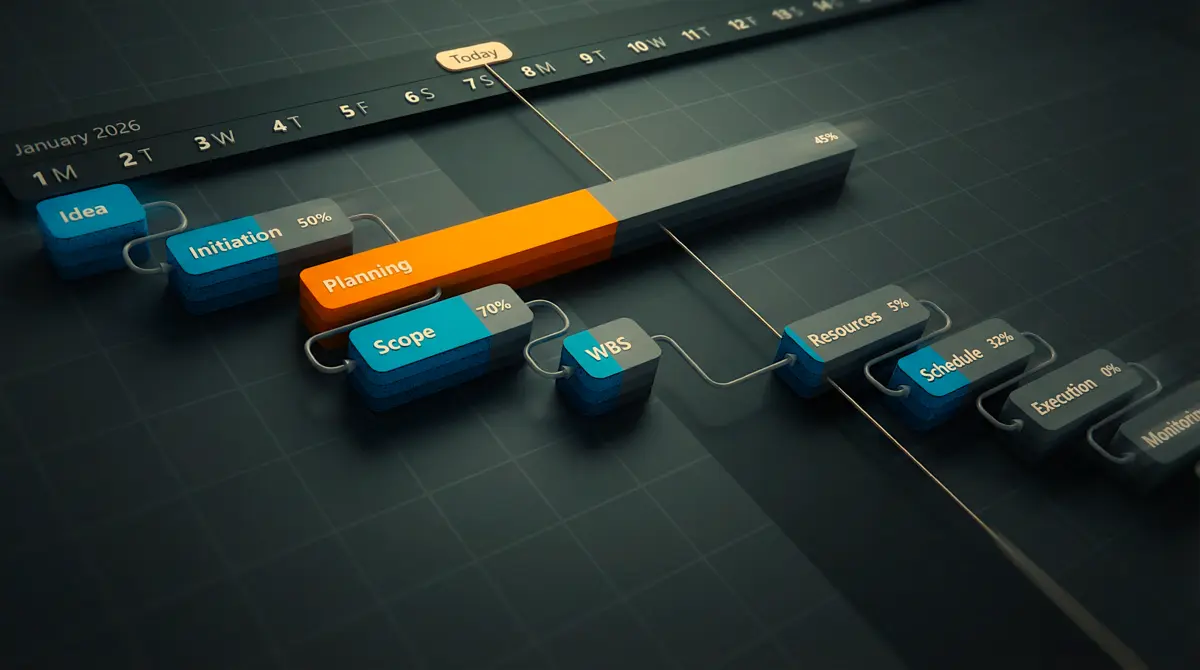
A Gantt chart is a horizontal bar chart that provides a visual view of a project schedule over time. Each bar represents a task, with its length indicating the duration and its position showing the start and end dates.
Key Components
- Tasks: Individual work items that need to be completed
- Timeline: The horizontal axis showing dates
- Dependencies: Connections between tasks showing relationships
- Milestones: Key dates or achievements in your project
Creating Your First Gantt Chart in YAPL
Step 1: Define Your Project Phases
Before diving into the Gantt chart, outline the major phases of your project:
- Planning and Research
- Design and Development
- Testing and Quality Assurance
- Deployment and Launch
Step 2: Break Down Tasks
For each phase, identify specific tasks that need to be completed. Keep tasks granular enough to track progress but not so small that they become unmanageable.
Step 3: Estimate Durations
Assign realistic time estimates to each task. Consider:
- Team capacity and availability
- Historical data from similar tasks
- Buffer time for unexpected challenges
Step 4: Set Dependencies
Link tasks that depend on each other. Common dependency types include:
| Type | Description | Example |
|---|---|---|
| Finish-to-Start | Task B can't start until Task A finishes | Testing after development |
| Start-to-Start | Tasks start simultaneously | Parallel workstreams |
| Finish-to-Finish | Tasks must finish together | Documentation with development |
Best Practices
Keep It Updated
A Gantt chart is only useful if it reflects reality. Update progress regularly and adjust timelines as needed.
Use Color Coding
YAPL allows you to visualize tasks clearly with:
- Status-based color coding
- Critical path highlighting
- Dependency visualization
- Progress tracking
Monitor the Critical Path
The critical path shows the longest sequence of dependent tasks. Any delay on this path will delay the entire project.
Common Mistakes to Avoid
- Over-optimistic estimates: Always add buffer time
- Missing dependencies: Review task relationships carefully
- Too much detail: Focus on meaningful milestones
- Ignoring resource constraints: Consider team capacity
Next Steps
Ready to create your first Gantt chart? Here's what to do:
- Open your project in YAPL
- Navigate to the Plans section
- Create a new plan and select Gantt view
- Start adding your tasks!
Have questions about Gantt charts? Check out our documentation or contact support for personalized assistance.
Ready to Improve Your Project Management?
Try YAPL free for 14 days and put these insights into practice.
Start Free Trial